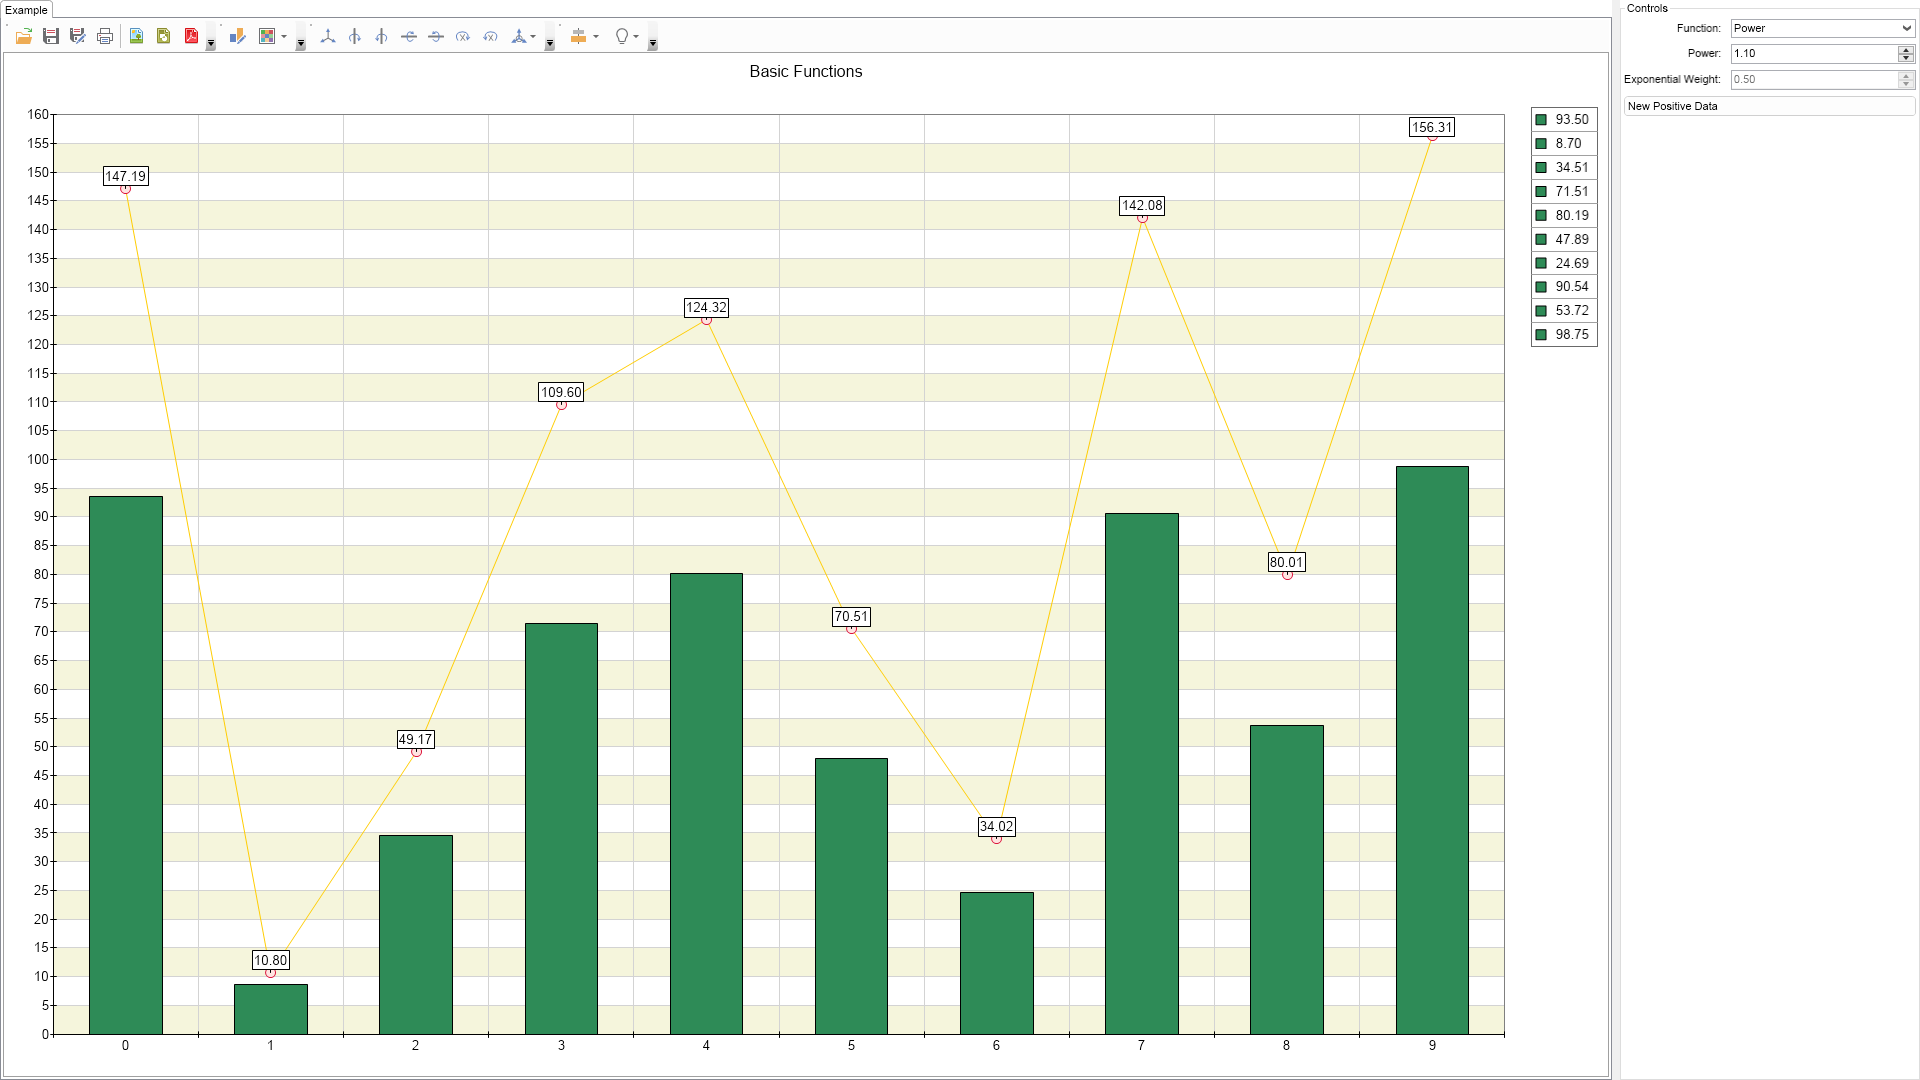
using Nevron.Nov;
using Nevron.Nov.Chart;
using Nevron.Nov.Dom;
using Nevron.Nov.Formulas;
using Nevron.Nov.Graphics;
using Nevron.Nov.Layout;
using Nevron.Nov.UI;
using Nevron.Nov.Windows.Forms;
using System.Windows.Forms;
namespace NovWinFormsProject
{
public partial class Form1 : Form
{
#region Constructors
public Form1()
{
InitializeComponent();
// Set form title
Text = "NOV WinForms - NPowerCumulativeExpAverageExample";
// Create the NOV example and its controls
NWidget exampleContent = CreateExampleContent();
NWidget exampleControls = CreateExampleControls();
if (exampleControls != null)
{
exampleControls.PreferredWidth = 300;
}
// Place the example and its controls in a pair box
NPairBox pairBox = new NPairBox(exampleContent, exampleControls);
pairBox.FillMode = ENStackFillMode.First;
pairBox.FitMode = ENStackFitMode.First;
pairBox.Margins = new NMargins(NDesign.HorizontalSpacing, NDesign.VerticalSpacing);
// Host the example in the form
NNovWidgetHost host = new NNovWidgetHost(pairBox);
host.Dock = DockStyle.Fill;
Controls.Add(host);
}
#endregion
#region Example
public NWidget CreateExampleContent()
{
NChartViewWithCommandBars chartViewWithCommandBars = new NChartViewWithCommandBars();
NChartView chartView = chartViewWithCommandBars.View;
chartView.Surface.CreatePredefinedChart(ENPredefinedChartType.Cartesian);
// configure title
chartView.Surface.Titles[0].Text = "Basic Functions";
// configure chart
NCartesianChart chart = (NCartesianChart)chartView.Surface.Charts[0];
// add interlaced stripe for Y axis
NScaleStrip strip = new NScaleStrip(new NColorFill(NColor.Beige), null, true, 0, 0, 1, 1);
strip.Interlaced = true;
chart.Axes[ENCartesianAxis.PrimaryY].Scale.Strips.Add(strip);
// add the first bar
m_Bar = new NBarSeries();
chart.Series.Add(m_Bar);
m_Bar.Name = "Green";
m_Bar.ValueFormatter = new NNumericValueFormatter("0.00");
m_Bar.MultiBarMode = ENMultiBarMode.Series;
m_Bar.DataLabelStyle = new NDataLabelStyle();
m_Bar.DataLabelStyle.Visible = false;
m_Bar.LegendView = new NSeriesLegendView();
m_Bar.LegendView.Mode = ENSeriesLegendMode.DataPoints;
m_Bar.Fill = new NColorFill(NColor.SeaGreen);
m_Bar.Stroke = new NStroke(NColor.Black);
m_Bar.Shape = ENBarShape.Rectangle;
// add a line series for the function
m_LineSeries = new NLineSeries();
chart.Series.Add(m_LineSeries);
m_LineSeries.InflateMargins = false;
m_LineSeries.Name = "Function";
m_LineSeries.DataLabelStyle = new NDataLabelStyle();
m_LineSeries.DataLabelStyle.Format = "";
m_LineSeries.MarkerStyle = new NMarkerStyle();
m_LineSeries.MarkerStyle.Shape = ENPointShape3D.Ellipse;
m_LineSeries.MarkerStyle.Visible = true;
m_LineSeries.MarkerStyle.Border = new NStroke(1, NColor.Crimson);
m_LineSeries.MarkerStyle.Fill = new NColorFill(NColor.MistyRose);
m_LineSeries.MarkerStyle.Size = new NSize(10, 10);
m_LineSeries.LegendView.Mode = ENSeriesLegendMode.None;
m_LineSeries.ValueFormatter = new NNumericValueFormatter("0.00");
return chartViewWithCommandBars;
}
public NWidget CreateExampleControls()
{
NStackPanel stack = new NStackPanel();
NUniSizeBoxGroup boxGroup = new NUniSizeBoxGroup(stack);
// function combo
m_FunctionComboBox = new NComboBox();
m_FunctionComboBox.Items.Add(new NComboBoxItem("Power"));
m_FunctionComboBox.Items.Add(new NComboBoxItem("Cumulative"));
m_FunctionComboBox.Items.Add(new NComboBoxItem("Exponential Average"));
m_FunctionComboBox.SelectedIndexChanged += (e) =>
{
CalculateFunction();
m_PowerNUD.Enabled = m_FunctionComboBox.SelectedIndex == 0;
m_ExponentialWeightNUD.Enabled = m_FunctionComboBox.SelectedIndex == 2;
};
stack.Add(NPairBox.Create("Function: ", m_FunctionComboBox));
// power nud
m_PowerNUD = new NNumericUpDown();
m_PowerNUD.Minimum = -10;
m_PowerNUD.Maximum = 10;
m_PowerNUD.Value = 1.1;
m_PowerNUD.Step = 0.01;
m_PowerNUD.DecimalPlaces = 2;
m_PowerNUD.ValueChanged += (e) =>
{
CalculateFunction();
};
stack.Add(NPairBox.Create("Power: ", m_PowerNUD));
// exponential weight nud
m_ExponentialWeightNUD = new NNumericUpDown();
m_ExponentialWeightNUD.Minimum = 0;
m_ExponentialWeightNUD.Maximum = 1;
m_ExponentialWeightNUD.Value = 0.5;
m_ExponentialWeightNUD.Step = 0.01;
m_ExponentialWeightNUD.DecimalPlaces = 2;
m_ExponentialWeightNUD.ValueChanged += (e) =>
{
CalculateFunction();
};
stack.Add(NPairBox.Create("Exponential Weight: ", m_ExponentialWeightNUD));
// new positive data button
NButton newPositiveDataButton = new NButton("New Positive Data");
newPositiveDataButton.Click += (e) =>
{
// fill with random data
RandomData();
};
stack.Add(newPositiveDataButton);
// fill with random data
RandomData();
// select first function
m_FunctionComboBox.SelectedIndex = 0;
return boxGroup;
}
public string GetExampleDescription()
{
return @"This example demonstrates how to create a standard bar chart.
";
}
///
/// Gets the relevant documentation links for the example
///
///
public (string Name, string Url)[] GetDocumentationUrls()
{
return new[]
{
("Chart Data Series", "https://www.nevron.com/docs/openvision/chart-data-series.html"),
("Statistical Functions", "https://www.nevron.com/docs/openvision/formula-statistical-functions.html"),
("Formulas Overview", "https://www.nevron.com/docs/openvision/formula-overview.html"),
("Array Functions", "https://www.nevron.com/docs/openvision/formula-array-functions.html"),
};
}
#endregion
#region Implementation
void RandomData()
{
double[] randomData = CreateRandomData(10, 0, 100);
m_Bar.DataPoints.Clear();
for (int i = 0; i < randomData.Length; i++)
{
NBarDataPoint barDataPoint = new NBarDataPoint();
barDataPoint.Value = randomData[i];
m_Bar.DataPoints.Add(barDataPoint);
}
CalculateFunction();
}
void CalculateFunction()
{
string formula;
switch (m_FunctionComboBox.SelectedIndex)
{
case 0: // power
formula = string.Format("POW(BarValues, {0})", m_PowerNUD.Value.ToString("0.00"));
break;
case 1: // cumulative
formula = "CUMSUM(BarValues)";
break;
case 2: // exponential average
formula = string.Format("EXPAVG(BarValues, {0})", m_ExponentialWeightNUD.Value.ToString("0.00"));
break;
default:
return;
}
// create a chart formula calculator in which:
// BarValues variable represents m_Bar Values
NFormulaCalculator calculator = new NFormulaCalculator();
calculator.Formula = formula;
calculator.Variables["BarValues"] = m_Bar.DataPoints.GetDataSeriesVariant("Value");
// calculate
NVariant result = calculator.Evaluate();
// display result arrays as line series
m_LineSeries.DataPoints.SetDataSeriesVariant(result, "Value");
}
#endregion
#region Event Handlers
#endregion
#region Fields
NBarSeries m_Bar;
NLineSeries m_LineSeries;
NComboBox m_FunctionComboBox;
NNumericUpDown m_PowerNUD;
NNumericUpDown m_ExponentialWeightNUD;
#endregion
#region Static Methods
#endregion
#region Constants
#endregion
#region Nested Types
#endregion
}
}

 Chart for .NET
 Diagram for .NET
 User Interface for .NET
 Vision for SSRS
 Chart for SSRS
 Gauge for SSRS
 Map for SSRS
 Barcode for SSRS
 Vision for SharePoint
 Chart for SharePoint
 Gauge for SharePoint
 Map for SharePoint
 Barcode for SharePoint
 Open Vision for .NET


 Vision for .NET