using Nevron.Nov;
using Nevron.Nov.Barcode;
using Nevron.Nov.Chart;
using Nevron.Nov.Chart.Tools;
using Nevron.Nov.Diagram;
using Nevron.Nov.Dom;
using Nevron.Nov.Graphics;
using Nevron.Nov.Layout;
using Nevron.Nov.UI;
using Nevron.Nov.Windows.Forms;
using System;
using System.Windows.Forms;
namespace NovWinFormsProject
{
public partial class Form1 : Form
{
#region Constructors
public Form1()
{
InitializeComponent();
// Set form title
Text = "NOV WinForms - NChartsInDiagramExample";
// Create the NOV example and its controls
NWidget exampleContent = CreateExampleContent();
NWidget exampleControls = CreateExampleControls();
if (exampleControls != null)
{
exampleControls.PreferredWidth = 300;
}
// Place the example and its controls in a pair box
NPairBox pairBox = new NPairBox(exampleContent, exampleControls);
pairBox.FillMode = ENStackFillMode.First;
pairBox.FitMode = ENStackFitMode.First;
pairBox.Margins = new NMargins(NDesign.HorizontalSpacing, NDesign.VerticalSpacing);
// Host the example in the form
NNovWidgetHost host = new NNovWidgetHost(pairBox);
host.Dock = DockStyle.Fill;
Controls.Add(host);
}
#endregion
#region Example
public NWidget CreateExampleContent()
{
// Create a simple drawing
NDrawingViewWithRibbon drawingViewWithRibbon = new NDrawingViewWithRibbon();
m_DrawingView = drawingViewWithRibbon.View;
m_DrawingView.Document.HistoryService.Pause();
try
{
InitDiagram(m_DrawingView.Document);
}
finally
{
m_DrawingView.Document.HistoryService.Resume();
}
return drawingViewWithRibbon;
}
public NWidget CreateExampleControls()
{
return null;
}
public string GetExampleDescription()
{
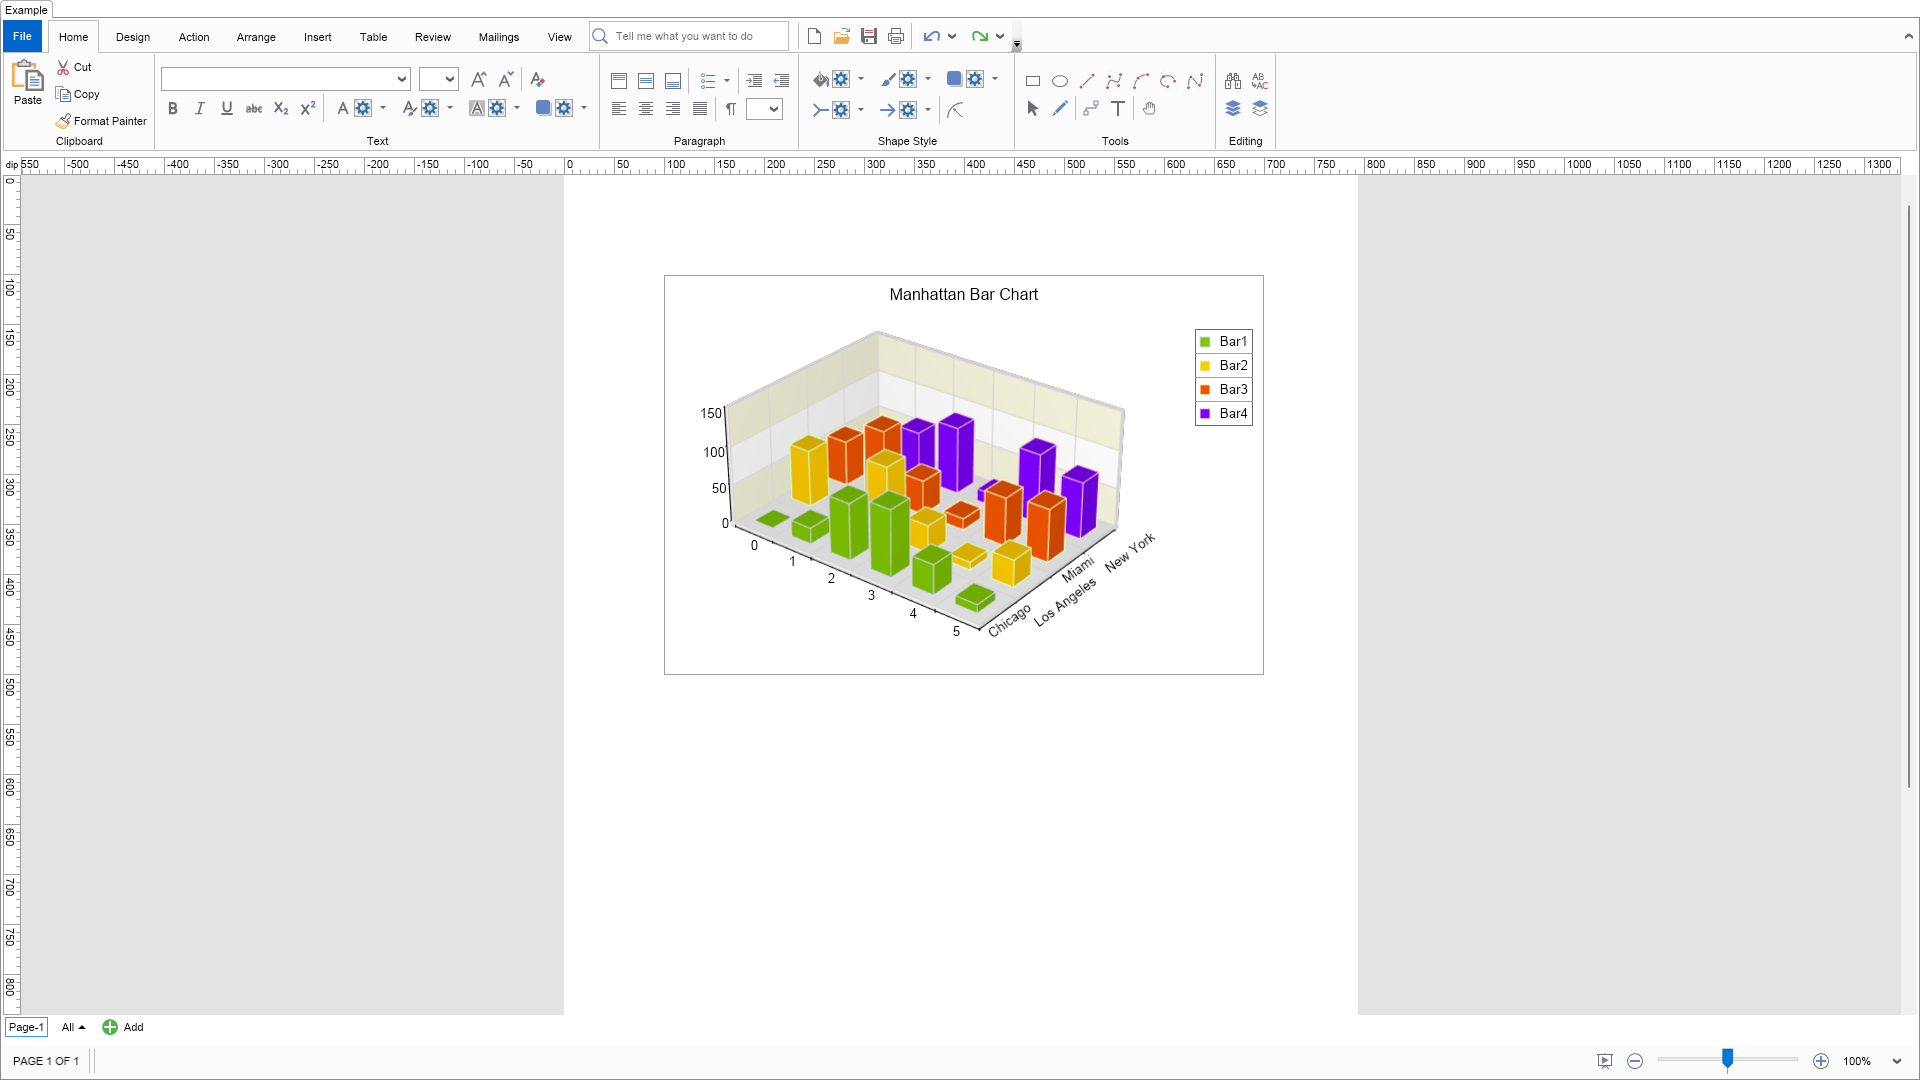
return @"Demonstrates how to create and host charts in diagram shapes.
";
}
///
/// Gets the relevant documentation links for the example
///
///
public (string Name, string Url)[] GetDocumentationUrls()
{
return new[]
{
("Shapes", "https://www.nevron.com/docs/openvision/diagram-shapes.html"),
("Chart Overview", "https://www.nevron.com/docs/openvision/chart-overview.html"),
("Text Block", "https://www.nevron.com/docs/openvision/diagram-text-block.html"),
("Chart Types Overview", "https://www.nevron.com/docs/openvision/chart-types-overview.html"),
("Chart Data Series", "https://www.nevron.com/docs/openvision/chart-data-series.html"),
};
}
private void InitDiagram(NDrawingDocument drawingDocument)
{
NPage activePage = drawingDocument.Content.ActivePage;
// Create a barcode widget
NChartView chartView = new NChartView();
chartView.Surface.CreatePredefinedChart(ENPredefinedChartType.Cartesian);
NCartesianChart chart = (NCartesianChart)chartView.Surface.Charts[0];
// configure title
chartView.Surface.Titles[0].Text = "Manhattan Bar Chart";
// configure chart
chart.Enable3D = true;
chart.ModelWidth = 60;
chart.ModelHeight = 25;
chart.ModelDepth = 45;
chart.FitMode = ENCartesianChartFitMode.Aspect;
chart.Interactor = new NInteractor(new NTrackballTool());
// apply predefined projection and lighting
chart.Projection.SetPredefinedProjection(ENPredefinedProjection.PerspectiveTilted);
chart.LightModel.SetPredefinedLightModel(ENPredefinedLightModel.BrightCameraLight);
// add axis labels
NOrdinalScale ordinalScale = chart.Axes[ENCartesianAxis.Depth].Scale as NOrdinalScale;
ordinalScale.Labels.TextProvider = new NOrdinalScaleLabelTextProvider(new string[] { "Chicago",
"Los Angeles",
"Miami",
"New York" });
ordinalScale.DisplayDataPointsBetweenTicks = true;
ordinalScale.Labels.Style.Angle = new NScaleLabelAngle(ENScaleLabelAngleMode.Scale, 0);
ordinalScale = chart.Axes[ENCartesianAxis.PrimaryX].Scale as NOrdinalScale;
ordinalScale.MajorGridLines.SetShowAtWall(ENChartWall.Bottom, true);
ordinalScale.MajorGridLines.SetShowAtWall(ENChartWall.Back, true);
// add interlace stripe to the Y axis
NLinearScale linearScale = chart.Axes[ENCartesianAxis.PrimaryY].Scale as NLinearScale;
NScaleStrip stripStyle = new NScaleStrip(new NColorFill(NColor.Beige), null, true, 0, 0, 1, 1);
stripStyle.Interlaced = true;
stripStyle.SetShowAtWall(ENChartWall.Back, true);
stripStyle.SetShowAtWall(ENChartWall.Left, true);
linearScale.Strips.Add(stripStyle);
// add the first bar
NBarSeries bar1 = new NBarSeries();
chart.Series.Add(bar1);
bar1.MultiBarMode = ENMultiBarMode.Series;
bar1.Name = "Bar1";
bar1.Stroke = new NStroke(1, NColor.FromRGB(210, 210, 255));
// add the second bar
NBarSeries bar2 = new NBarSeries();
chart.Series.Add(bar2);
bar2.MultiBarMode = ENMultiBarMode.Series;
bar2.Name = "Bar2";
bar2.Stroke = new NStroke(1, NColor.FromRGB(210, 255, 210));
// add the third bar
NBarSeries bar3 = new NBarSeries();
chart.Series.Add(bar3);
bar3.MultiBarMode = ENMultiBarMode.Series;
bar3.Name = "Bar3";
bar3.Stroke = new NStroke(1, NColor.FromRGB(255, 255, 210));
// add the second bar
NBarSeries bar4 = new NBarSeries();
chart.Series.Add(bar4);
bar4.MultiBarMode = ENMultiBarMode.Series;
bar4.Name = "Bar4";
bar4.Stroke = new NStroke(1, NColor.FromRGB(255, 210, 210));
// add some data
Random random = new Random();
for (int i = 0; i < 6; i++)
{
bar1.DataPoints.Add(new NBarDataPoint(random.Next(100)));
bar2.DataPoints.Add(new NBarDataPoint(random.Next(100)));
bar3.DataPoints.Add(new NBarDataPoint(random.Next(100)));
bar4.DataPoints.Add(new NBarDataPoint(random.Next(100)));
}
// Create a shape and place the barcode widget in it
NShape shape = new NShape();
shape.SetBounds(100, 100, 600, 400);
shape.Widget = chartView;
activePage.Items.Add(shape);
}
#endregion
#region Implementation
#endregion
#region Event Handlers
#endregion
#region Fields
private NDrawingView m_DrawingView;
#endregion
#region Static Methods
#endregion
#region Constants
#endregion
#region Nested Types
#endregion
}
}

 Chart for .NET
 Diagram for .NET
 User Interface for .NET
 Vision for SSRS
 Chart for SSRS
 Gauge for SSRS
 Map for SSRS
 Barcode for SSRS
 Vision for SharePoint
 Chart for SharePoint
 Gauge for SharePoint
 Map for SharePoint
 Barcode for SharePoint
 Open Vision for .NET


 Vision for .NET