ProductsAll Products
.NET Components
 Open Vision for .NET
 NOV Chart for .NET
 NOV Diagram for .NET
 NOV Rich Text Editor for .NET
 NOV Grid for .NET
 NOV Schedule for .NET
 NOV Gauge for .NET
 NOV Barcode for .NET
 NOV User Interface for .NET
 Vision for .NET
 Chart for .NET
 Diagram for .NET
 User Interface for .NET
 Vision for SSRS
 Chart for SSRS
 Gauge for SSRS
 Map for SSRS
 Barcode for SSRS
 Vision for SharePoint
 Chart for SharePoint
 Gauge for SharePoint
 Map for SharePoint
 Barcode for SharePoint
DownloadsAll Downloads
| ||||||||
|
Key Reference Values
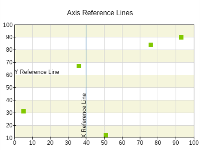
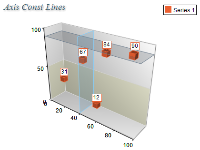
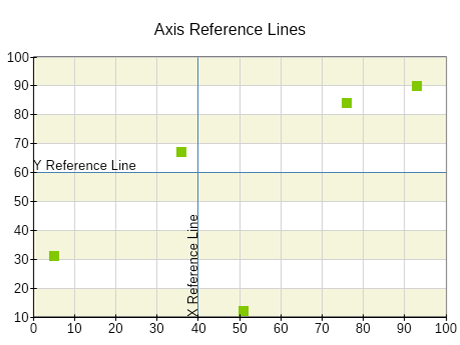
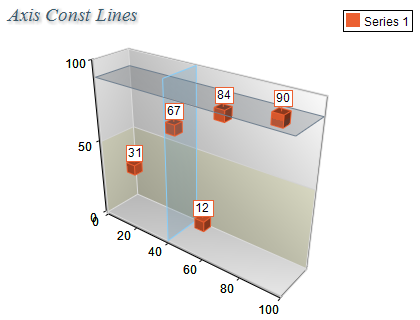
Use constant lines for key references like critical thresholds, target values, or averages with constant lines to guide interpretation.
Use Distinct Styling
Style constant lines differently from gridlines—e.g., dashed lines, different colors, or increased thickness.
Limit the Number of Constant Lines
Use only a few to avoid visual clutter; too many reference lines can overwhelm the chart.
Align with Context
Place constant lines where they add value—don’t force them if they don’t highlight a meaningful insight.
Use Tooltips for Interactivity
In interactive charts, enhance constant lines with tooltips or hover info for additional context.
Support Multiple Axes
If using dual axes, clearly associate constant lines with the correct axis via color or label alignment.