ProductsAll Products
.NET Components
 Open Vision for .NET
 NOV Chart for .NET
 NOV Diagram for .NET
 NOV Rich Text Editor for .NET
 NOV Grid for .NET
 NOV Schedule for .NET
 NOV Gauge for .NET
 NOV Barcode for .NET
 NOV User Interface for .NET
 Vision for .NET
 Chart for .NET
 Diagram for .NET
 User Interface for .NET
 Vision for SSRS
 Chart for SSRS
 Gauge for SSRS
 Map for SSRS
 Barcode for SSRS
 Vision for SharePoint
 Chart for SharePoint
 Gauge for SharePoint
 Map for SharePoint
 Barcode for SharePoint
DownloadsAll Downloads
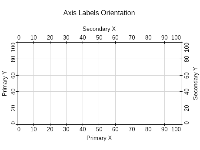
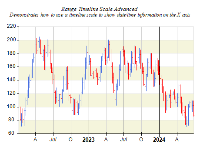
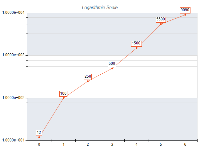
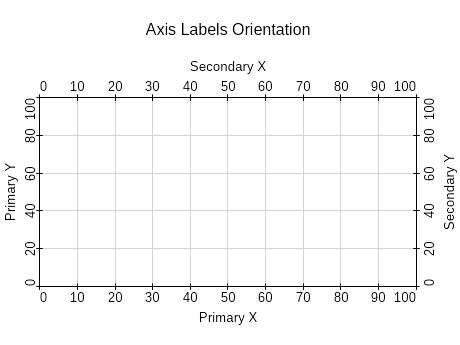
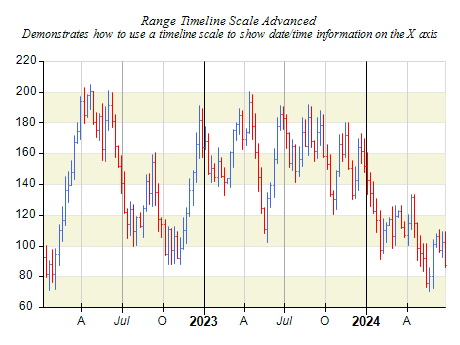
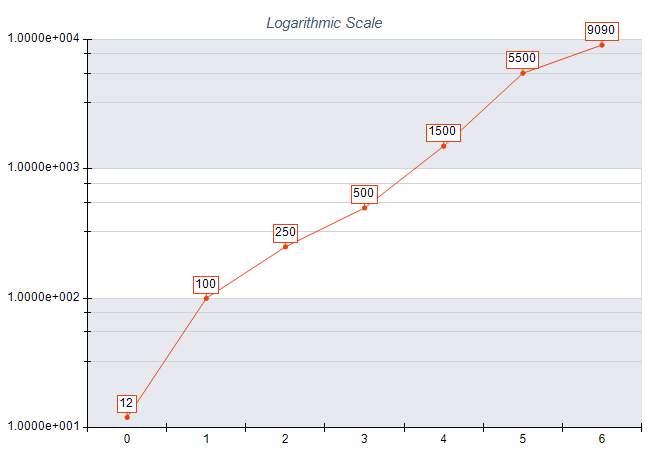
Label formatting refers to the customization of text labels on chart and gauge axes. Proper label formatting significantly enhances the clarity and aesthetic appeal of a chart, making it easier for viewers to understand the presented data. The control supports various label formatting options to accommodate different data types, such as numeric values, date/time values, and time span values. In addition to label formatting, the control provides various options to customize the label's appearance, including font, font style, color, size, and more.
| ||||||||||||
|
Measurement Units
Include units when applicable. Display units (e.g., %, $, kg) directly on the label or on the axis title.
Abbreviated Numbers
Abbreviate large numbers. Use suffixes like K (thousands), M (millions), or B (billions) to simplify labels without losing meaning and avoid unnecessary numbers of zeros.
Legible Fonts
Ensure font legibility. Use readable font sizes and styles, try using sans serif fonts, combined with appropriate font size.
Automatic Label Spacing
Avoid clutter and fixed axis steps. This limits the number of labels by using the automatic axis label generation of the chart to prevent crowding of the axis.
Localized Formatting
Use localized formatting. Synchronize number formats, decimal separators, and date formats with the current culture (this is the default).
Appropriate Decimal Precision
Use a level of decimal precision that balances accuracy and readability. Avoid excessive decimals that confuse users.
Formats That Match the Time Scale
Use appropriate date/time formats based on the time scale (e.g., year-only for long ranges, full timestamps for short intervals) or simply let the scale decide.
Short Formats for Limited Space
Use shorter date/time formats when space is limited.