Avoid Overuse and Consider Performance
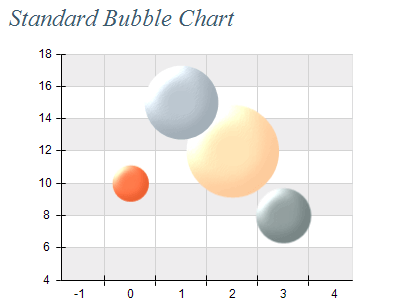
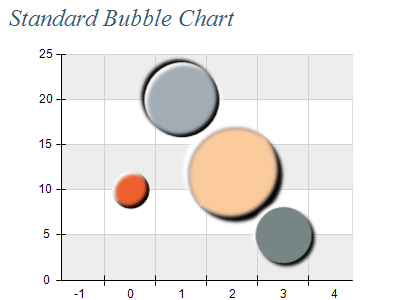
Image filters should be primarily used in presentation charting, where performance is not critical. Using image filters for larger charts can be very computationally expensive.
Use Emboss to Highlight Edges
Use the emboss image filter effect to highlight bar and area edges and add a sense of dimensionality to flat chart elements.
Layer Effects
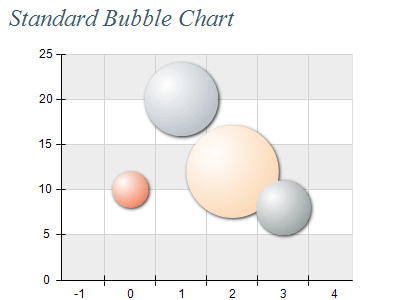
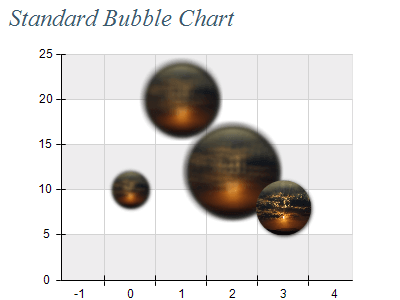
Combine multiple filters to achieve a more refined look. For example, a slight blur on the background and an embossing on the data point elements can make the chart more visually appealing.
Maintain Clarity
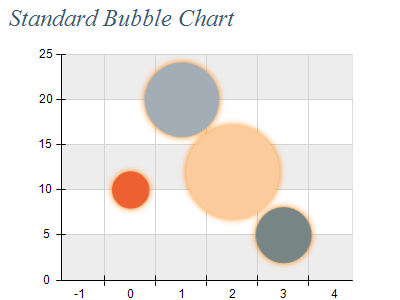
Ensure that filters do not reduce the readability of text or important chart details. Always prioritize data clarity.

 Open Vision for .NET
 NOV Chart for .NET
 NOV Diagram for .NET
 NOV Rich Text Editor for .NET
 NOV Grid for .NET
 NOV Schedule for .NET
 NOV Gauge for .NET
 NOV Barcode for .NET
 NOV User Interface for .NET
 Vision for .NET
 Chart for .NET
 Diagram for .NET
 User Interface for .NET
 Vision for SSRS
 Chart for SSRS
 Gauge for SSRS
 Map for SSRS
 Barcode for SSRS
 Vision for SharePoint
 Chart for SharePoint
 Gauge for SharePoint
 Map for SharePoint
 Barcode for SharePoint