ProductsAll Products
.NET Components
 Open Vision for .NET
 NOV Chart for .NET
 NOV Diagram for .NET
 NOV Rich Text Editor for .NET
 NOV Grid for .NET
 NOV Schedule for .NET
 NOV Gauge for .NET
 NOV Barcode for .NET
 NOV User Interface for .NET
 Vision for .NET
 Chart for .NET
 Diagram for .NET
 User Interface for .NET
 Vision for SSRS
 Chart for SSRS
 Gauge for SSRS
 Map for SSRS
 Barcode for SSRS
 Vision for SharePoint
 Chart for SharePoint
 Gauge for SharePoint
 Map for SharePoint
 Barcode for SharePoint
DownloadsAll Downloads
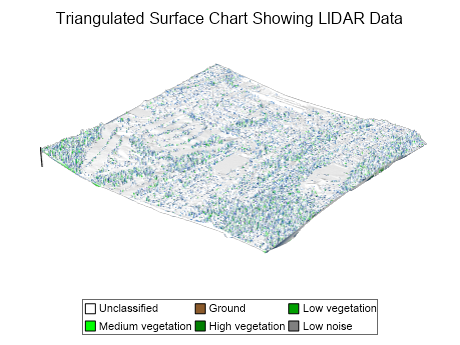
The Triangulated Surface Chart displays three-dimensional data as a mesh of triangles. It constructs a Delaunay triangulation from the data points projected onto the horizontal plane and uses their heights to form the surface. Delaunay triangulation maximizes the minimum angle of the triangles, helping avoid unnecessarily narrow triangles. Some point arrangements can produce more than one valid triangulation.
The Triangulated Surface provides various options, including smooth and flat shading, custom color per vertex, palette filling, and others.
| ||||||||||||
|
| X Value | Y Value | Z Value |
|---|---|---|
| 2 | 5 | 10 |
| 4 | 5 | 20 |
| 6 | 5 | 15 |
| 8 | 5 | 5 |
| 10 | 5 | 30 |
Choose the Chart Type
The Triangulated Surface Chart best displays data sets that contain XYZ coordinates without any order. In case the data set implies an order for the coordinates, or the coordinates have common X/Z values, you can consider using the Mesh or Grid surface charts, as constructing a Delaunay triangulation is computationally expensive.
Choose the Right Color Map
Choose a color map that best represents your data. A good color map should provide contrast and allow users to identify areas of interest easily.
Label Your Chart
Add labels and annotations to your chart to provide context and make it easier for users to understand the data they view.
Customize Your Chart
Use the chart's customization features to customize the appearance of your chart, including shading, labels, and annotations. This can help make your data stand out and make it easier to read.
Use Appropriate Scaling
Ensure your chart is scaled appropriately to represent your data accurately. Use the chart's axis scaling features to adjust the scaling as necessary.