ProductsAll Products
.NET Components
 Open Vision for .NET
 NOV Chart for .NET
 NOV Diagram for .NET
 NOV Rich Text Editor for .NET
 NOV Grid for .NET
 NOV Schedule for .NET
 NOV Gauge for .NET
 NOV Barcode for .NET
 NOV User Interface for .NET
 Vision for .NET
 Chart for .NET
 Diagram for .NET
 User Interface for .NET
 Vision for SSRS
 Chart for SSRS
 Gauge for SSRS
 Map for SSRS
 Barcode for SSRS
 Vision for SharePoint
 Chart for SharePoint
 Gauge for SharePoint
 Map for SharePoint
 Barcode for SharePoint
DownloadsAll Downloads
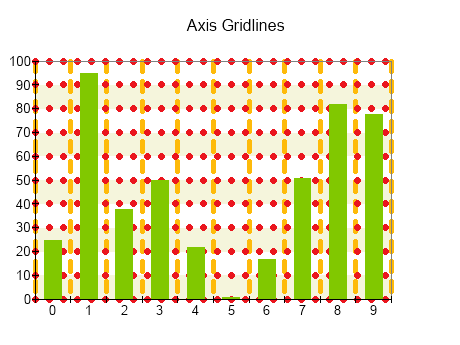
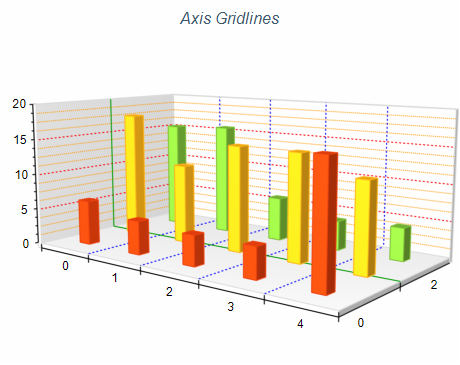
Scale gridlines are synchronized with the scale major and minor tick values and are used to measure and interpret the data that is displayed by the control. Gridlines appear on the plot of Cartesian, Ternary, Polar, and Radar charts. They can also appear on the chart walls in 3D Cartesian charts.
| ||||||||
|
Use Grid Lines to Improve Readability
Grid lines help users estimate data values and align data points with axes.
Keep Them Subtle
Use light colors, thin or dashed lines, or partial transparency so they don’t distract the user from the data.
Alignment with Major Ticks
Align grid lines with major ticks by default to maintain a clean and readable chart plot.
Minimize Minor Grid Lines
Only include minor grid lines when they provide additional needed precision.
Enable Horizontal or Vertical Lines Selectively
For certain charts, like bar or line charts, it may be more effective to use only horizontal or only vertical grid lines.