ProductsAll Products
.NET Components
 Open Vision for .NET
 NOV Chart for .NET
 NOV Diagram for .NET
 NOV Rich Text Editor for .NET
 NOV Grid for .NET
 NOV Schedule for .NET
 NOV Gauge for .NET
 NOV Barcode for .NET
 NOV User Interface for .NET
 Vision for .NET
 Chart for .NET
 Diagram for .NET
 User Interface for .NET
 Vision for SSRS
 Chart for SSRS
 Gauge for SSRS
 Map for SSRS
 Barcode for SSRS
 Vision for SharePoint
 Chart for SharePoint
 Gauge for SharePoint
 Map for SharePoint
 Barcode for SharePoint
DownloadsAll Downloads
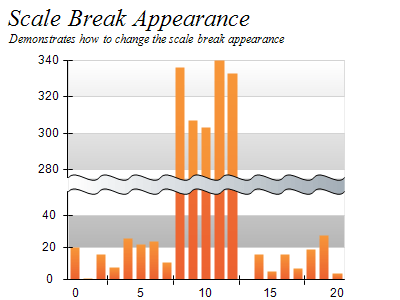
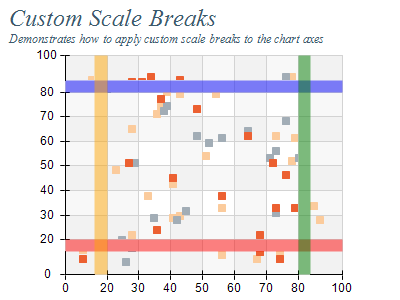
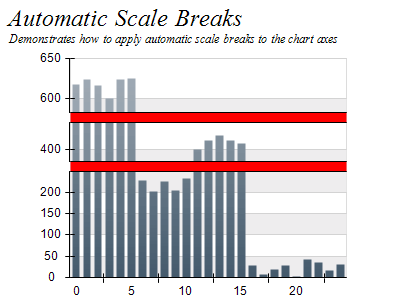
Scale breaks skip a selected range or ranges on an axis, giving the remaining ranges more space. They make charts easier to read when large gaps or outliers in data would otherwise compress the visual space available for the rest of the data. That way scale breaks increase the readability of the chart.
Nevron Chart supports scale breaks on all axis types in both 2D and 3D, with control over their position and appearance.
| ||||||||||||
|
Use Scale Breaks to Handle Outliers and Enhance Readability
Apply breaks when one or more values are significantly outside the typical range which prevents the user from viewing the rest of the data.
Unobtrusive Break Styles
Use a scale break style that is less obstructive like a jagged or wavy line with minimal deviation to avoid obscuring the chart plot by the scale break decoration.
Clear Break Labels
Label the scale break area. Provide text near the break to explain it, such as "empty range (20-40)".
Limited Use
Use sparingly. Only use scale breaks when necessary as excessive or unnecessary breaks can confuse readers.
Breaks on a Single Axis
Apply breaks to only one axis when possible as axes with multiple scale breaks can confuse the reader.