ProductsAll Products
.NET Components
 Open Vision for .NET
 NOV Chart for .NET
 NOV Diagram for .NET
 NOV Rich Text Editor for .NET
 NOV Grid for .NET
 NOV Schedule for .NET
 NOV Gauge for .NET
 NOV Barcode for .NET
 NOV User Interface for .NET
 Vision for .NET
 Chart for .NET
 Diagram for .NET
 User Interface for .NET
 Vision for SSRS
 Chart for SSRS
 Gauge for SSRS
 Map for SSRS
 Barcode for SSRS
 Vision for SharePoint
 Chart for SharePoint
 Gauge for SharePoint
 Map for SharePoint
 Barcode for SharePoint
DownloadsAll Downloads
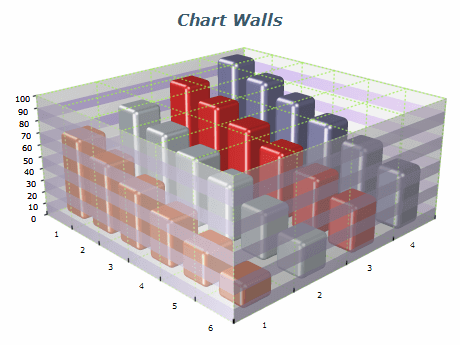
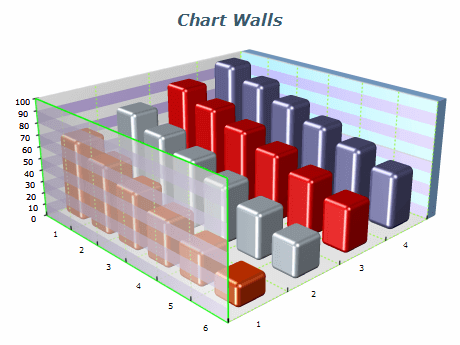
Chart walls are an essential component of charts that help create a realistic 3D look and improve the presented data's readability. They are especially important in 3D Cartesian charts, which have six walls, one for each side of the chart box.
In 2D Cartesian charts, as well as in Polar, Radar, and Ternary charts only the back wall can be displayed, which can still contribute to the overall look and feel of the chart.
Chart walls can display information from the axes, such as gridlines, stripes, etc., which helps to increase the chart readability. In 3D mode charts have an option for "smart" visibility - that is not to display when the wall will obscure the 3D content.
| ||||||||
|
Use Chart Walls for Depth and Structure
In 3D charts, walls can help provide perspective and orientation.
Minimize Distraction
Use neutral or light tones for walls to keep attention on the data and to distinguish the chart bounds from the background.
Keep Gridlines Visible
Ensure that axis gridlines are not obscured by overly dark or textured walls.
Automatic Wall Hiding
Use the chart walls auto-hide feature to automatically hide chart walls that obscure data when the chart is rotated.