ProductsAll Products
.NET Components
 Open Vision for .NET
 NOV Chart for .NET
 NOV Diagram for .NET
 NOV Rich Text Editor for .NET
 NOV Grid for .NET
 NOV Schedule for .NET
 NOV Gauge for .NET
 NOV Barcode for .NET
 NOV User Interface for .NET
 Vision for .NET
 Chart for .NET
 Diagram for .NET
 User Interface for .NET
 Vision for SSRS
 Chart for SSRS
 Gauge for SSRS
 Map for SSRS
 Barcode for SSRS
 Vision for SharePoint
 Chart for SharePoint
 Gauge for SharePoint
 Map for SharePoint
 Barcode for SharePoint
DownloadsAll Downloads
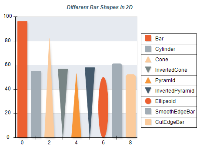
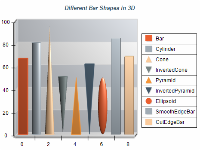
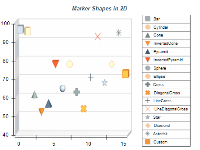
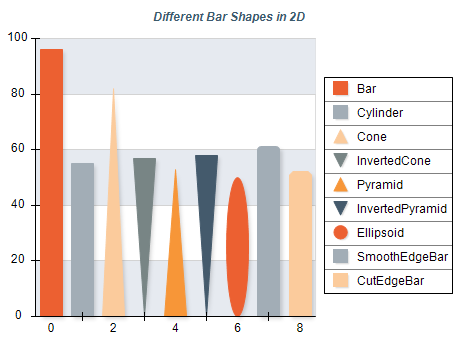
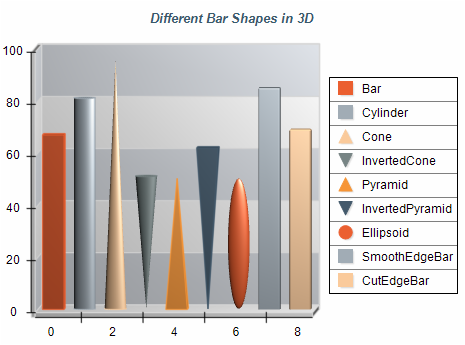
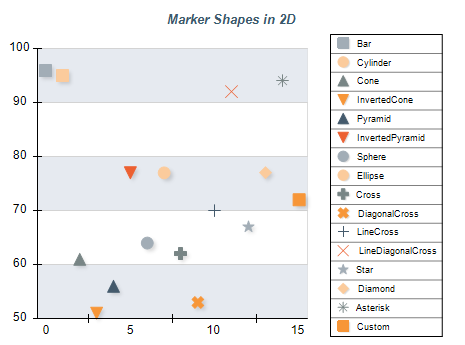
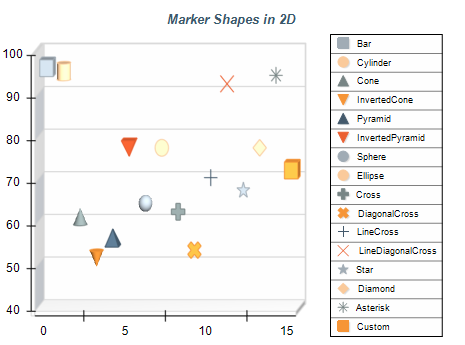
Nevron Chart supports a myriad of predefined shapes in 2D and 3D that can be displayed by different data points, markers, and other visual items.
Having a large selection of shapes is essential for improving the clarity and impact of your data presentations, as it offers a wide range of options for highlighting trends, distinguishing different data types, and drawing attention to specific data points.
| ||||||||||||||||
|
Use of 3D Shapes with Smooth Edges
Rendering smoothed edge bars and pies is computationally expensive, so such shapes should be used only in presentation charts, where performance is not critical.
Use of Marker Shapes
Use markers to highlight individual data points. Ensure that marker styles look distinct so users can easily distinguish them.
Provide Context
Provide context for shapes and markers by properly describing the marker's meaning, preferably in a legend next to the chart.