ProductsAll Products
.NET Components
 Open Vision for .NET
 NOV Chart for .NET
 NOV Diagram for .NET
 NOV Rich Text Editor for .NET
 NOV Grid for .NET
 NOV Schedule for .NET
 NOV Gauge for .NET
 NOV Barcode for .NET
 NOV User Interface for .NET
 Vision for .NET
 Chart for .NET
 Diagram for .NET
 User Interface for .NET
 Vision for SSRS
 Chart for SSRS
 Gauge for SSRS
 Map for SSRS
 Barcode for SSRS
 Vision for SharePoint
 Chart for SharePoint
 Gauge for SharePoint
 Map for SharePoint
 Barcode for SharePoint
DownloadsAll Downloads
Three Line Break Chart | ||
|
| Date | Close Price | Trend Direction |
|---|---|---|
| 2022-01-01 | 100 | N/A |
| 2022-01-02 | 105 | Up |
| 2022-01-03 | 102 | Down |
| 2022-01-04 | 98 | Down |
| 2022-01-05 | 96 | Down |
| 2022-01-06 | 103 | Up |
Understand the Concept
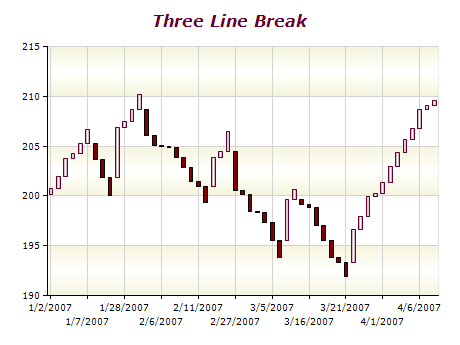
A Three Line Break chart adds a continuation line when the closing price moves beyond the end of the latest line in the current trend. After three lines in the same direction, a reversal requires a close beyond the opposite extreme of those three lines. Price changes that meet neither condition do not add a line.
Choose the Reversal Period
The reversal period is the number of previous lines whose price range must be exceeded to reverse the trend. Three is the standard setting. Increasing the number generally filters out more short-term reversals, while decreasing it makes the chart more responsive to price changes.
Combine with Other Indicators
Three-line break charts can be used in conjunction with other indicators such as moving averages or support and resistance levels to confirm trends or identify potential entry and exit points.
Use for Medium to Long-term Analysis
Three-line break charts are best suited for medium to long-term analysis as they can help filter out short-term noise and provide a clearer picture of the overall trend.