ProductsAll Products
.NET Components
 Open Vision for .NET
 NOV Chart for .NET
 NOV Diagram for .NET
 NOV Rich Text Editor for .NET
 NOV Grid for .NET
 NOV Schedule for .NET
 NOV Gauge for .NET
 NOV Barcode for .NET
 NOV User Interface for .NET
 Vision for .NET
 Chart for .NET
 Diagram for .NET
 User Interface for .NET
 Vision for SSRS
 Chart for SSRS
 Gauge for SSRS
 Map for SSRS
 Barcode for SSRS
 Vision for SharePoint
 Chart for SharePoint
 Gauge for SharePoint
 Map for SharePoint
 Barcode for SharePoint
DownloadsAll Downloads
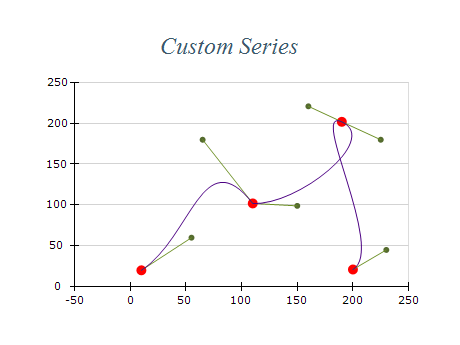
Chart Custom Series | ||
|
| X Value | Y Value | Color |
|---|---|---|
| 10 | 20 | Red |
| 20 | 30 | Blue |
| 30 | 40 | Green |
| 40 | 50 | Red |
| 50 | 60 | Blue |
Use Appropriate Chart Type
The Custom Series is a powerful tool that can be used to create a wide range of visualizations, but it's important to choose the appropriate chart type for your data. Consider whether a line chart, bar chart, scatter plot, or other chart type best suits your needs.
Keep It Simple
While the Custom Series allows for complex visualizations, it's important to keep it simple and avoid clutter. Use color, shape, and other visual elements sparingly to highlight the most important aspects of your data.
Test and Refine
Once you've created your Custom Series, test it with different data sets and scenarios to ensure it's effective and informative. Refine your visualization as needed to improve its clarity and impact.